
Coolset Academy
Make the complex visible
A chart to find the priority. A diagram to explain the connection. A workflow to show the next step.
These are design examples. The numbers and workflows are illustrative.

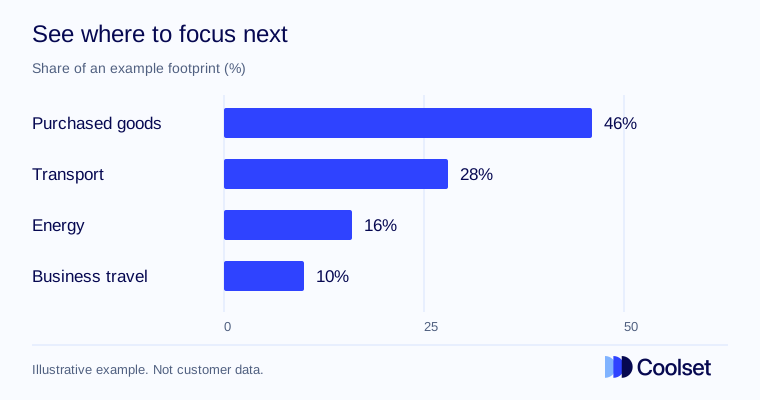
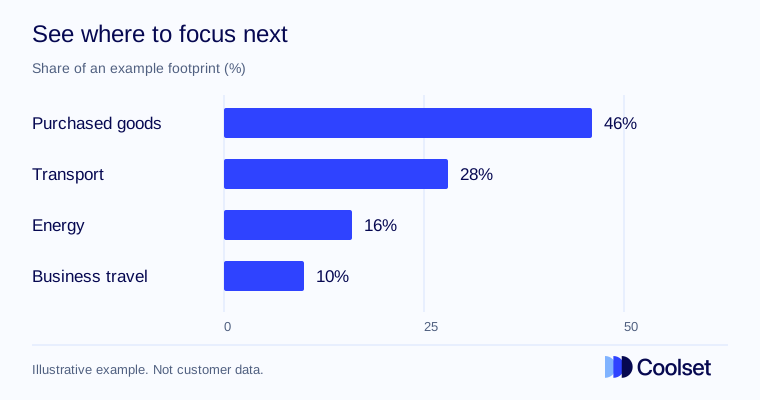
A clear comparison
Use a labelled chart when the reader needs to compare values. Keep one scale and show the source.
A useful workflow
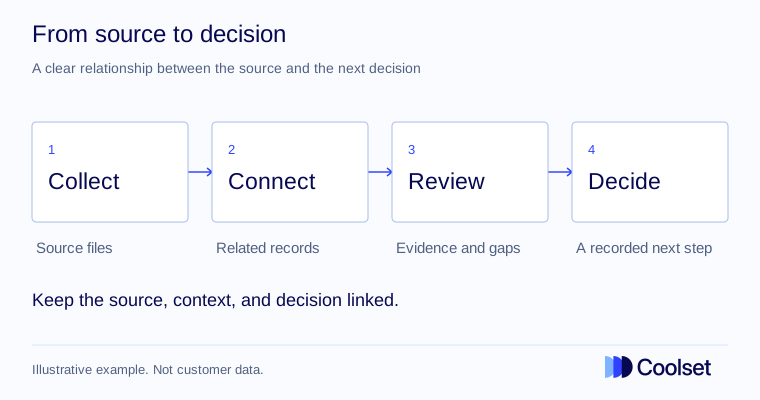
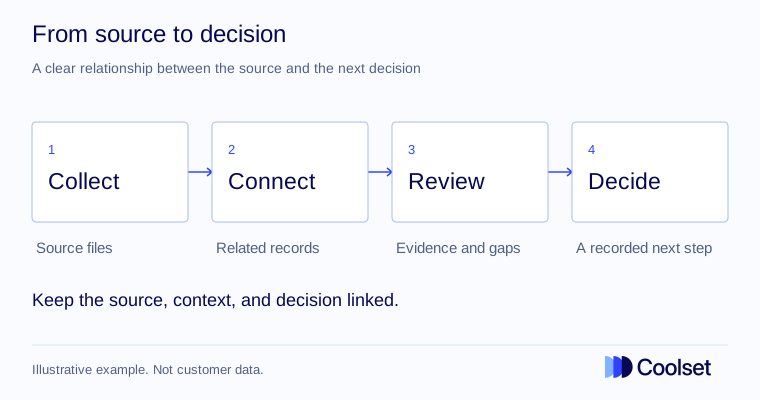
Use a diagram when the reader needs to understand the order of work. Give each step a clear purpose.
A traceable explanation
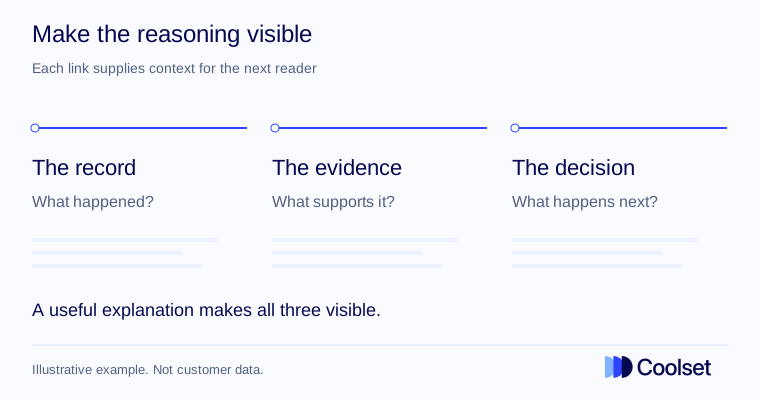
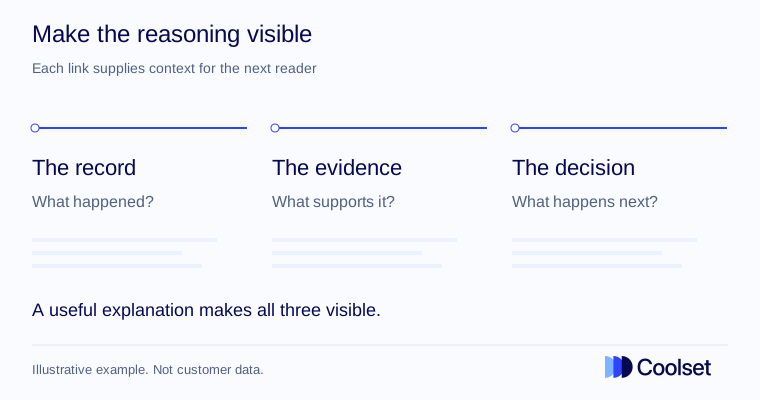
Use a simple visual relationship to connect a record, its evidence, and the decision that follows.
Part of the article
Give every visual a useful title, a plain description, and a source or example label. Keep the Coolset mark on downloads.
See a visual inside an article Compare the brand patterns